Since our last post on the subject of social media and the referendum, the campaign has ramped up considerably. We have seen offers of further devolved powers from all of the parties supporting a ‘no’ vote, interventions from businesses such as Shell and Lloyds Bank expressing concern over Scotland leaving the UK, TV debates, economic arguments, elections to the European Parliament, and the beginning of the ‘official’ campaign. All of this is before we even consider the interventions of US President Barack Obama, his former Secretary of State Hillary Clinton, Pope Francis, the unveiling of a draft constitution for an independent Scotland, not to mention author JK Rowling’s donation to the No campaign. Given all these developments, and with only three months to go until the referendum, it is timely to reflect on the social media campaigns of each side.
New data from the ESRC/AQMeN project tracking referendum activity on social media shows that the Yes Scotland campaign continues to have the advantage over the Better Together campaign in terms of online enthusiasm, and that it has solidified its lead on both Facebook and Twitter over the past four months. Our analysis is based on a tracking of the social media activity of the two main campaigns, Yes Scotland (YS) and Better Together (BT), by monitoring their respective Facebook and Twitter accounts on weekdays since August 2013.
Examining Facebook first, the green continuous line in Figure 1 tracks the difference in the number of Facebook ‘likes’ each campaign’s official Facebook page has received. It is calculated by subtracting the likes for the Better Together campaign’s page from the likes for the Yes Scotland page. Likes for a Facebook page can be interpreted as a measure of interest and/or support for a campaign and, given it requires minimal effort (just a click of a button), is the easiest way for an individual to engage with the online campaign of either side. Our data show that not only has the YS campaign consistently received more likes than the BT campaign, but also that this lead has been increasing. When we started our tracking last August, the YS campaign had been liked more than the BT campaign page to the tune of 9,000 likes. Today, the YS page had been liked no less than 32,000 more times than the BT page. Our data suggest that this increase in the YS lead overlapped with the White Paper on independence launch, and in mid-March 2014, which coincided with the Scottish Conservative Conference, Labour’s launch of its devolution blueprint, and a debate on Scottish independence broadcast by the BBC.
However, the gap between the two sides did appear to close in the final week of May 2014, just after the elections to the European Parliament, and at a time when both campaigns were engaged in strong debate about the economy. During that one week the BT ‘likes’ for increased by approx. 8,000, well above the weekly average.
But since the official campaign began on 30 May 2014, the YS campaign have increased and consolidated their lead in ‘likes’. But Facebook ‘likes’ is just one measure. The purple broken line in Figure 1 represents the difference in extent to which the two sets of campaign Facebook pages have been ‘talked about’ on average during the previous seven days. It measures the ‘interaction’ with each campaign’s page, as indicated by the average number of likes per page, the number of posts to a page wall, the level of liking/commenting/sharing of a wall post, and the number of phototags. This provides a more detailed indication of people’s engagement with the campaigns.
We observe that, for the most part, the Yes side has on average been ‘talked about’ more than the BT side has been during the past ten months. Although, there have been occasions when the BT page has outpaced the YS page – for example in May 2014, coinciding with the release of a report by Moody’s on the financial implications of independence. But for the most part, the YS campaign has maintained an advantage over the BT campaign.
Since the official campaign started (30 May 2014), both campaigns have been ‘talked about’ even more on Facebook than before. And while the YS campaign has maintained its lead for the most part, the BT campaign has, on average been more talked about of late, and has been generating similar levels of interaction on its page as on the YS Facebook page.
Figure 2 examines Twitter, which is different to Facebook in the sense that it is a more instantaneous social media platform and can be expected to attract a different audience from Facebook. (For example, more journalists might be expected to subscribe to a campaign’s Twitter account compared with their FB account). The orange dashed line in Figure 2 shows the difference between the number of people ‘following’ the Yes Scotland Twitter account and those following the Better Together one. On this measure, The YS camp has maintained a consistent lead over BT, with the lead steadily growing over time. Whereas the difference in followers stood at just over 8,000 at the beginning of our analysis in August 2013, at the time of writing the difference stands at just over 23,000. The increase in the lead for the YS campaign does not appear to have occurred at any particular point in time – rather we observe a gradual increase.
The blue line in Figure 2 details the difference in the number of tweets emanating from each campaign’s account. At the beginning of our analysis, the BT campaign had actually tweeted more times than the YS campaign. This remained the case until mid-March 2014, when the YS campaign surpassed the BT campaign for the first time in number of tweets. Since then, YS have been more active on Twitter than BT, and as of now the YS campaign has tweeted nearly 800 times more than the BT campaign.
As with our two previous commentaries in February this year and November last year, the picture emerging from our analysis is that the Yes side, at least to date, has been coming out on top in terms of generating greater enthusiasm online. So what are the potential reasons behind the Yes online advantage? We have speculated previously that a strong reason could be the age profile of social media users, who tend to be young, and who in turn are more likely to support independence. Support for this proposition is heightened as, according to Facebook, the interactions on both campaign pages are most likely to come from those aged 18-34. We have also speculated about the impact of particular campaign events. However, we are cautious in reading too much into the impact of specific incidents.
There are, after all, other possible reasons for these patterns. For example, it could be that those backing Yes side are simply more engaged in their campaign than are No supporters. Consequently, Yes supporters may be more likely than No supporters to express their views in a public forum. A recent poll by TNS BMRB did show for example that Yes supports were three times more likely to have discussed the independence question online. Another potential issue to consider is the observation of Professor Michael Keating that the campaign ground war favours the Yes side because the No campaign includes two parties that are currently weak in Scotland, the Conservative and Liberal Democrats, leaving much of the ground war to Labour.
Whatever lies behind the Yes advantage online, the challenge of converting this advantage into votes at the ballot box on the 18 September still remains. The next 90 days will see if this can be achieved.
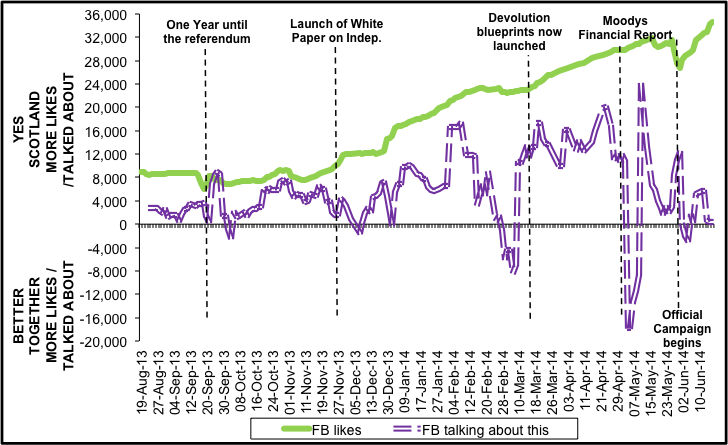
Figure 1 ‘Yes Scotland’ (YS) score minus the ‘Better Together’ (BT) score for two Facebook indicators over time (for further details see text). In each case, a positive score indicates that the YS campaign scored more highly and a negative score that the BT campaign scored more highly. (The direction of the scoring is purely arbitrary.)
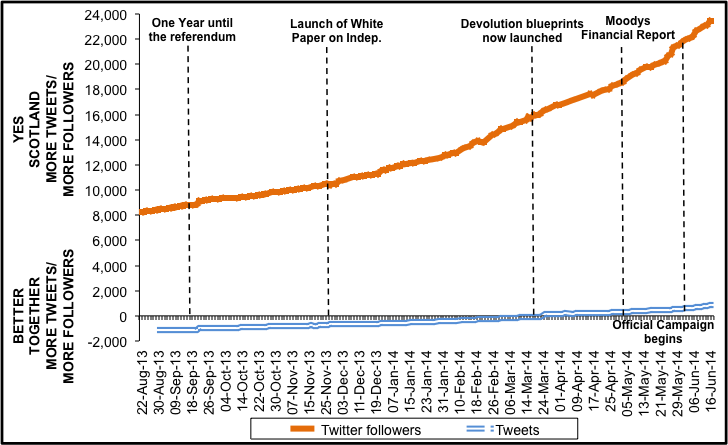
Figure 2 ‘Yes Scotland’ (YS) score minus the ‘Better Together’ (BT) score for two Twitter indicators over time (for further details see text). In each case, a positive score indicates that the YS campaign scored more highly and a negative score that the BT campaign scored more highly. (The direction of the scoring is purely arbitrary.)
This blog piece was co-authored with Dr. Mark Shephard, principal investigator on the ESRC/AQMeN Future of the United Kingdom and Scotland research project focusing on the impact of social media on the Scottish independence referendum and Senior Lecturer at the School of Government and Public Policy, University of Strathclyde.
About the author
Dr. Stephen Quinlan is senior researcher at the GESIS Leibniz Institute for the Social Sciences, Mannheim and is part of the ESRC/AQMeN Future of the United Kingdom and Scotland research project focusing on the impact of social media on the Scottish independence referendum.